"CertGenWizard.exe is a wizard tool which will take your CA information as
input (it isn't required if you are running the wizard on the box with the CA),
take in the computer names (has to be FQDNs), and send out a request for the
certificates you need. Now, you no longer have to fill out the Certificate
Request form or enter parameters or connect to the web enrollment service.
Once the certificates are approved, there is a Retrieve button in the
CertGenWizard which will allow you to retrieve the certificates that you have
requested. On top of the personal certificates, the wizard will retrieve
the root CA certificate.
The biggest benefit to this tool is the
added ability to request multiple certificates at once. If you have 100
non-domain joined agents that you need to set up cert auth for, you can simply
request all 100 machine certificates at once, retrieve them all, and manually
bring them over to your other machines.
Once you have
brought them to your other machines, CertInstaller.exe is a second
tool that will install the certificates into the local machine store of
your computer and run MOMCertImport.exe for you. Note: Install OpsMgr
Agent FIRST and then run the tool!"This tool will make lives easier for all those who need to deploy large numbers of SCOM agents that will require certificates to communicate.
Monday, August 25, 2008
SCOM: New certificates tool from the OpsMgr Product team
SCOM: Sending notifications for a specific alert
Just raising awareness of this invaluable tool. Stephan Koell brings us an excellent powershell script that fills the gaping hole of not being able to send notification on specific alerts.
As many SCOM admins are already aware, SCOM out of the box only allows you to scope your notification subscriptions by target type, group, and severity. This works for most cases, however every client I've worked with to-date has expressed a need for a notification on a specific email.
Examples:
1. Exchange admins want emails for all exchange alerts, however they only want paged in the middle of the night if the servers go down.
2. A security analist only wants emails when a specific event is generated in the security logs on DC's.
3. A developer only wants to be emailed if the specific application pool for his application goes down.
Not possible via the gui by default. What the powershell linked below gives us is the ability to create a subscription that appears in the console (though cannot be modified) that notifies only when a specific alert name is detected.
I implemented this successfully today for a client, I find that it works best to use a generic recipient name, so you can later add notification channels should more people need the email that is generated.
Several other tips:
- See the comments about altering the script to use your local time zone
- The alert you target when running the PS script MUST have been generated at least once in the past.
- The script out of the box will only watch for alerts generated from monitors. There is a comment that includes a code update to include rules as well, however I have not yet tested that.
http://code4ward.net/cs2/blogs/code4ward/archive/2007/09/19/set-notificationforalert.aspx
Friday, June 27, 2008
SCOM: How to change time range in performance view in the Web console.
This time range can be changed for all web console by altering a file on the server hosting the Web Console as follows.
1. Open web.config in the (InstallDirectory)\Web Console on the server that hosts the Web console with notepad.
2. Add the following key under configuration, appsettings:

The following is an example of what to change in web.config to set the console to show 48 hours worth of data:

Excellent tip from Michael Pearson at Microsoft.
Monday, June 23, 2008
SCOM: Alert - Agent proxying needs to be enabled...
Since the release of SP1, you may have noticed a number of the following alerts generated from your RMS or a management server:
Agent proxying needs to be enabled for a health services to submit discovery data about other computers.
If you look at the alert details you'll see something like this:
Details:Health service ( 26ACBEF7-C424-4943-FFA6-6BF4E1C1D18B ) should not generate data about this managed object (52A4944E-FCB2-B4D7-0E51-AF18AB48434C ).
Although this alert is generated from your MS/RMS, what it actually means is that the agent proxy setting needs to be enabled on an agent that is connected to that server. The obvious question is: Which agent actually needs to have the setting enabled?
The alpha numeric strings are actually GUIDs, one referencing the Management Server, the other the agent itself. To determine the agent based on the GUID, run the following query against the OpsDB:
select * from basemanagedentity
where basemanagedentityid = '52A4944E-FCB2-B4D7-0E51-AF18AB48434C '
Note that the GUID pasted in is typically the second GUID listed. Note also that I have observed these GUIDs to be transposed on occasion, so the rule of thumb is to run this query against both GUIDs, disregarding the GUID of the MS/RMS.
Thursday, May 15, 2008
OpsMgr Data Warehouse: Changing the number of days that data is stored
Stumbled across this post out in the news groups a while back and have referenced it numerous times. Vitaly Filimonov at Microsoft has provided this comprehensive explanation of changing data retention settings for the various forms of data in the data warehouse.
"Unfortunately, OpsMgr2007 does not have UI to change data retention
settings, but you can do it by modifying columns in certain tables inside
OperationsManagerDW database.
There are two places in the DW where we store data retention-related
settings. For “config space” (your management packs, rules they contain,
overrides you’ve created, etc) and “instance space” (objects discovered,
their properties and relationships, etc.) we store setting inside the
MaintenanceSetting table. Here are the columns of interest and their default
values:
Instance space settings:
1. LastInstanceGroomingDateTime - the last time grooming operations were
performed;
2. InstanceGroomingFrequencyMinutes - frequency of the grooming process
start (default: 480)
3. (most important) InstanceMaxAgeDays - maximum age (since the day instance
was deleted) for the instance space objects (default: 400)
4. InstanceMaxRowsToGroom - maximum number of objects to delete in one run
(default: 5000).
Config space settings:
1. LastConfigGroomingDateTime - the last time grooming operations were
performed;
2. ConfigGroomingFrequencyMinutes - frequency of the grooming process start
(default: 60)
3. ManagementPackMaxAgeDays - maximum age for the management pack (since the
day MP was uninstalled) (default: 400)
4. NonSealedManagementPackMaxVersionCount - maximum # of non-sealed MP
versions to preserve (independent of the age) (default: 3)
Based on these settings for config space, sealed MP will be removed 400 days
after it was uninstalled from all management groups that are members of the
DW. Non-sealed MPs play by the same rules, but in addition we keep up to 3
old versions of non-sealed MP maximum.
Now, to the data. Each data type is stored in a separate structure called
“dataset”. There is Performance dataset for perf data, state dataset for
monitor state transitions, event dataset for events, etc. etc. MPs may
introduce new datasets as well. All datasets in existence known today are
so-called “standard datasets”. For those, we have a set of tables that hold
description of the dataset including data retention policies. Non-standard
datasets may be introduced (we do not know of one today though) and they
don’t have to follow the same rules - data retention settings for
non-standard datasets are dataset specific.
For standard dataset data retention is set at the “aggregation” level. Such
that performance “raw” data (samples themselves) stored certain number of
days which may be different from the number of days daily aggregates of
performance counters are stored. These settings are stored in the
StandardDatasetAggregation table. Here are the columns of interest. Note
that “primary key” of the table is composite consisting of dataset id (you
can lookup which dataset is which id in the Dataset table and
AggregationTypeId which can be looked up at the AggregationType table). The
defaults very by dataset / aggregation type:
1. MaxDataAgeDays - maximum number of days to store data;
2. GroomingIntervalMinutes - grooming process frequency;
3. MaxRowsToGroom - max number of rows to delete per transaction (see note
below);
4. LastGroomingDateTime - last time grooming process run.
One important note here is that we do not always groom data row-by row. If
data inflow is high (which is usually the case in medium-to-large
organizations for performance and event data) we create additional tables to
store data. For example, we store first 10M performance samples in the first
table. Once we get more data we leave the first table there, create second
table and start inserting into it. At the same time we calculate min and max
date for the data in the first table (and store it separately in the
StandardDatasetTableMap table). Then the grooming process works like that
(for certain dataset/aggregation type combination): Check to see if we have
only one table. If one - delete records row-by-row using DELETE TOP and
using MaxRowsToGroom parameter. If there is more then one table, find the
table with the oldest “max date” for data in it. If the “max date” is older
then retention period - drop entire table if not, leave everything there.
So, we do not necessarily “up to date” on grooming all the time. If you
have a table which spans one month, we will keep some records one month
longer then really needed, but performance gains of dropping whole table vs.
row deletes is so huge that we think it is way better to store a bit more
data for a bit longer then to pay the penalty.
Hope, this helps.
–
Vitaly Filimonov [MSFT]
——————————————-
This posting is provided “AS IS” with no warranties, and confers no rights.
Use of included script samples are subject to the terms specified at
http://www.microsoft.com/info/cpyright.htm"
OpsMgr: Performance reports not showing data
"When I run a performance report against a single machine I get no data."
A very commonly asked question in the news groups. The resolution is quite simple:
When running a performance report against a single machine, use the 'Add Group' button for that machine rather than the 'Add Object' button.

The reason for this lies in the way that performance counters are assigned to objects in SCOM. For example, a CPU performance counter may not necessarily be "owned" by a specific computer object. Figuring out that assignment can be painful. However when 'Add Group' is used rather than 'Add Object', you are basically telling SCOM "I want this counter data for this machine. You figure the rest out." A bit unorthodox but it works.
Credit goes to Vitaly Filimonov at Microsoft for explaining this.
Additionally, here is a more thorough explanation of this from Kevin Holman:
http://blogs.technet.com/kevinholman/archive/2008/04/21/why-do-my-reports-show-no-data.aspx
Wednesday, May 14, 2008
OpsMgr: Monitoring the Event Log - Part 1
Event log monitoring is arguably the bread and butter of SCOM. There is plenty of flexibility in other directions, but from the customers I've dealt with most custom monitors that are needed deal with the event log. In this post I'll discussing Event Log properties.
If you've built any event log monitors and have needed to specify any properties other than the default of 'ID' and 'Source', you likely have seen that only a handful of the event properties are available to choose from:
These present a good starting point, but what if you want to look for a particular Event Type, or perhaps text in the Event Description?
The answer is to use the 'Use parameter name not specified' option. This option allows you to specify any parameter including those not listed above, provided that you know the parameter name. Here are the parameter names that can be specified:

So for example, if we wanted to create a rule to look for an event in the application event log from the source "App01", with an ID of "123", that has the text "Error 1 encountered" in the body of the description, our expression would look like this:

That should clarify things a bit. I'll be posting the next part in this series soon that will address customization of alert descriptions shortly.
Monday, April 28, 2008
OpsMgr: ASP.net monitoring
In the area of .Net monitoring there are two prominent options, both presented by AVIcode.
Option 1: Licensed Managment Pack
This option is basically a shim for OpsMgr into the Avicode monitoring software. AVIcode offers an extremely comprehensive monitoring tool for ASP.net, and this managment pack basically builds rules and monitors in OpsMgr that are fed off of this tool. Further, it actually integrates the OpsMgr UI with the AVIcode UI to a degree, so when you are invenstigating an alert in OpsMgr you can dig into it via AVIcode reporting via the OpsMgr UI. I've deployed this for a client who already used the AVIcode tool. The customer was very satisfied, particularly since they were aiming for a single monitoring interface for all tools.
Good stuff if you are looking for extensive ASP.net monitoring.
Option 2: Free Management Pack
This little known MP is included on the Ops Mgr install CD. It provides basic monitoring only however I've deployed it for several clients as well who are looking for casual .Net monitoring and it has suited their needs well.
Location: \MangementPacks\Microsoft.SystemCenter.ASPNET20.2007.mp
Documenation: http://www.avicode.com/AVIcodeDownloads/PDFs/Overview%20of%20ASP.NET%202.0%20MP.pdf
There's a good write-up of this MP out on SystemCenterForum, as well as a comment from AVIcode directly: http://www.systemcenterforum.org/web-service-monitoring-in-operations-manager-and-essentials-2007/
Thursday, April 17, 2008
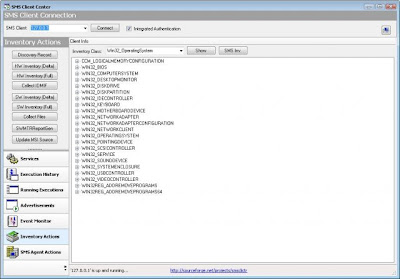
SCCM Tool: Client Center
Stumbled across this excellent tool out on Sourceforge: SMS Client Center. Has every action you could ever want in SMS all in a very slick gui. And most importantly it works in SCCM as well.
Major credit to rzanders and skissinger on Sourceforge for their work on this.
http://sourceforge.net/projects/smsclictr/
SCCM - Software inventory failing on XP clients: ~0000.exe
For those who have been around the SMS block, there are any number of reasons why a software inventory can fail. DNS, firewall rules, Management Point issues etc. All of these reasons have been well documented on MyITforum.com, as well as numerous other SMS/SCCM resources. This was a new one.
Issue:
The current client that I'm working with was seeing that the Software inventory had never run on approximately 50% of their environment since SCCM was deployed to all servers and desktops last fall. (This problem was identified by running the 'Inventory dates for a specific computer' report, and seeing a blank value for half of the workstations in the list.) Digging further in revealed that the issue was workstation-specific as all servers were running inventory as scheduled.
The log files were showing that the MIF's were making it to the management point, however the processing of the MIF's was failing. As a result the 'badsinv' inbox had thousands of .sid's and .sic's.
Resolution
The culprit for this problem is Symantec Ghost. When imaging a workstation, certain version of ghost drop a temporary file that is not removed: ~0000.exe This file is located here:
C:\Documents and Settings\All Users\Application Data\Symantec\Ghost\AutoInstall\Installed Applications\~0000.exe
This file is dated with the year 1601. Apparently the Microsoft SCCM developers forgot to account for the all-to-common scenario of handling files that were created during the colonization of America.
Once this file was either removed or skipped and a full software inventory was run, the issue was resolved (see my post prior to this for a script to run that scan).
Important note on skipping directorys in your inventory scans: Most are probably aware that 'Skpswi.dat' can be created used to exclude directorys and subdirectories from software inventory. A not so widely known fact is that software inventory will only exclude the directory if Skpswi.dat is hidden.
So when you create your blank text file & rename it to Skpswi.dat, make sure you check the box to make it hidden before deploying.